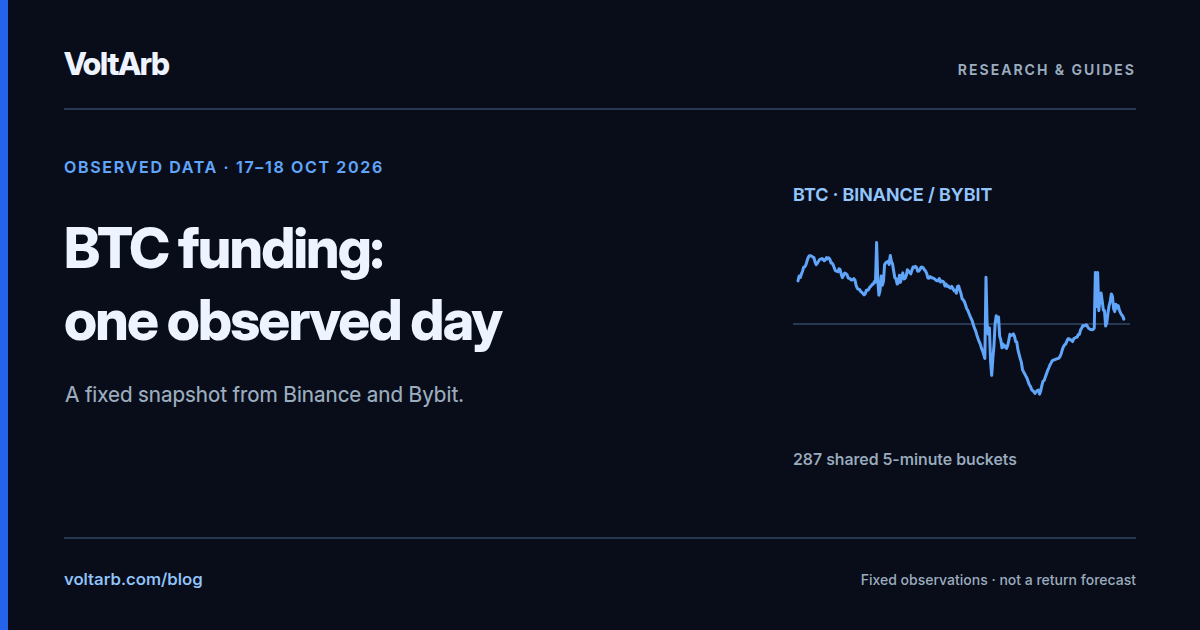
A fixed snapshot you can verify
At 10:11:31 UTC on 18 October 2026, we saved VoltArb’s public history response for BTC/USDT, with Binance-Futures as the first leg and Bybit-Futures as the second. The response contains 2,880 observations per venue. This case uses only the one-day window relative to the capture time.
The calculation includes completed five-minute buckets from 10:15 UTC on 17 October to, but not including, 10:10 UTC on 18 October. The last included bucket starts at 10:05. The initial and current partial buckets are excluded, so the expected count is 287 rather than 288.
The comparison direction is fixed: Bybit rate minus Binance rate. “Short” and “long” identify the calculation direction; no positions were opened for this case study.
The result within this window
| Metric | Value |
|---|---|
| Shared completed buckets | 287 / 287 |
| Bucket coverage | 100.0% |
| Positive / negative / zero | 184 / 103 / 0 |
| Positive-bucket share | 64.1% |
| Mean difference | +0.001316 pp |
| Median difference | +0.002363 pp |
| Minimum / maximum | -0.005402 / +0.006274 pp |
| Direct sign changes | 8 |
A positive mean coexists with 103 negative buckets and eight sign changes. One current value or average therefore does not describe the whole path. The 64.1% share belongs only to these saved observations; it is not a probability of a positive differential in the future.
Where the differential changed sign
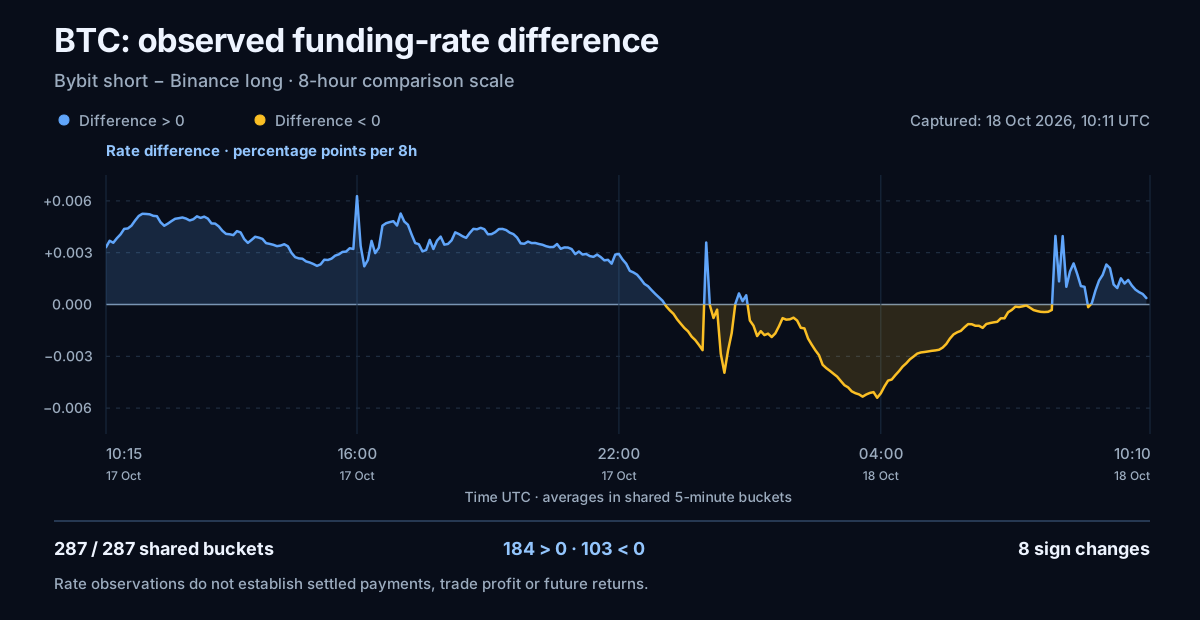
The line shows the observed rate difference in percentage points. It is not an equity curve. The area under it is not accumulated income: funding payments follow the contract schedule, not each five-minute observation bucket.
How to reproduce the calculation
- Fix the response capture time. Select the previous 86,400 seconds and retain only complete UTC buckets of 300 seconds.
- Deduplicate timestamps within each leg and average observed rates within its bucket. Use a bucket only when both legs have observations.
- Subtract the Binance average from the Bybit average. Source r values are decimal rates; multiplying the difference by 100 expresses it in percentage points.
- Calculate the mean and median of the resulting series. Positive buckets have a differential strictly greater than zero.
- Count a sign change only between adjacent buckets with opposite nonzero signs. A gap or intervening zero does not create a direct sign change.
The pair-research panel uses this algorithm. To reproduce the result without the app, download the source response and follow the steps above; the CSV contains the result for every shared bucket.
What this case does not establish
The eight-hour scale is a VoltArb data-model convention: rates are normalized using the ticker’s period or a venue fallback. The response does not retain each observation’s native period, so this case does not independently verify the venues’ complete historical schedules.
100% coverage means both venues have observations in every selected bucket. It is not a continuous market recording or second-level quote synchrony. A rate could change within a bucket, and the two records could arrive at different times.
The sample contains no confirmed funding receipts, executed orders, fees, slippage, entry/exit basis, margin or liquidation outcomes. It is therefore not a net-profit backtest. One day and one pair do not represent the whole market.
What to repeat in VoltArb
Start with free Rates and compare quotes. With Pro access, open the chosen pair in Arbitrage, its chart and Rate differential. Record the leg direction, window, coverage and freshness. Then separately verify the native payment schedule and execution conditions. A new sample will differ from this saved snapshot.
Data and provenance
Raw response JSON · 287 shared buckets CSV · Source, capture time and SHA-256
SHA-256: fe72c4561bd7e0d8bffce9d4cedacb4ef64d65d9dfec60694329c1a6cc073e94
The source is VoltArb’s public API. This response is fixed for the case; requesting the API again returns a different rolling window. The linked guides explain official funding-rate and payment mechanics with exchange sources.